

Cross Tabulation: Multi-level Correlation
Cross Tabulation is used to investigate potential relationships in responses to two or three close-ended questions. There are three sub-types under Cross Tabulation.
- Cross Tab – Two Level: Two different questions can be selected and compared in the horizontal and vertical variables of the report.
- Cross Tab – Three Level:This variation compares two questions with each other in horizontal and vertical variables of the report based on each answer option of a parent question.
- Pivot Table: Correlate responses to multiple questions based on how participants responded to a single question.
Cross Tabulation cannot be generated for open-ended questions.
Generate Cross Tabulation Report
Follow these steps to generate either type of the report:
- Select your project and click on Report.
- On the Report menu bar, click on Cross Tabulation.
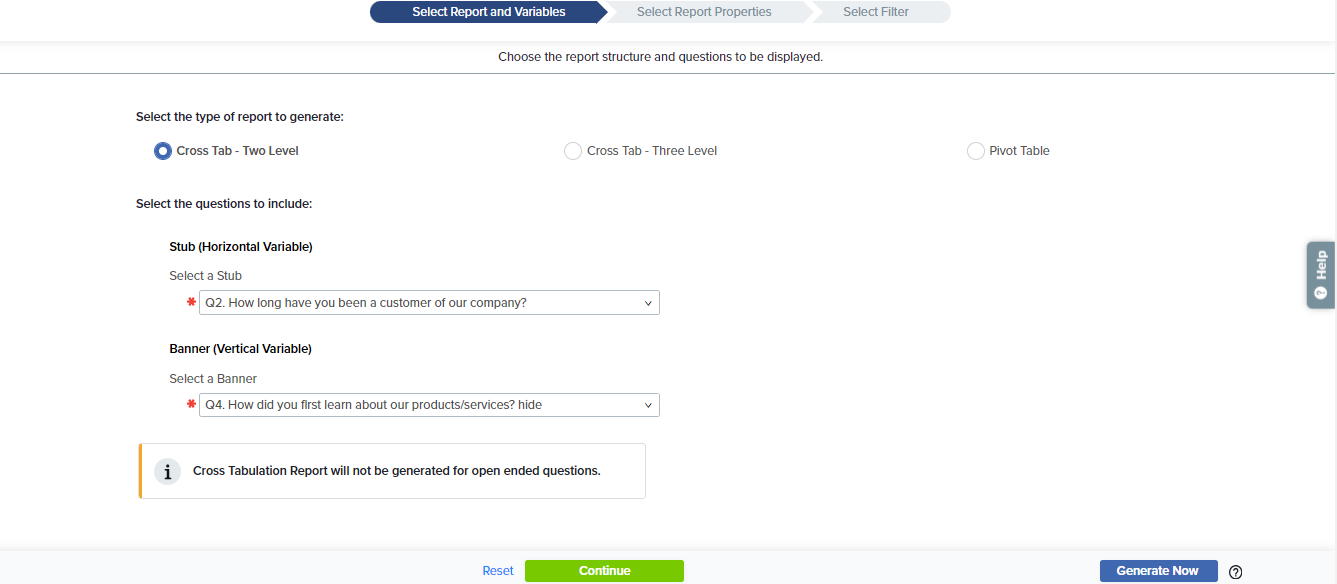
- Choose the type of report from the following:
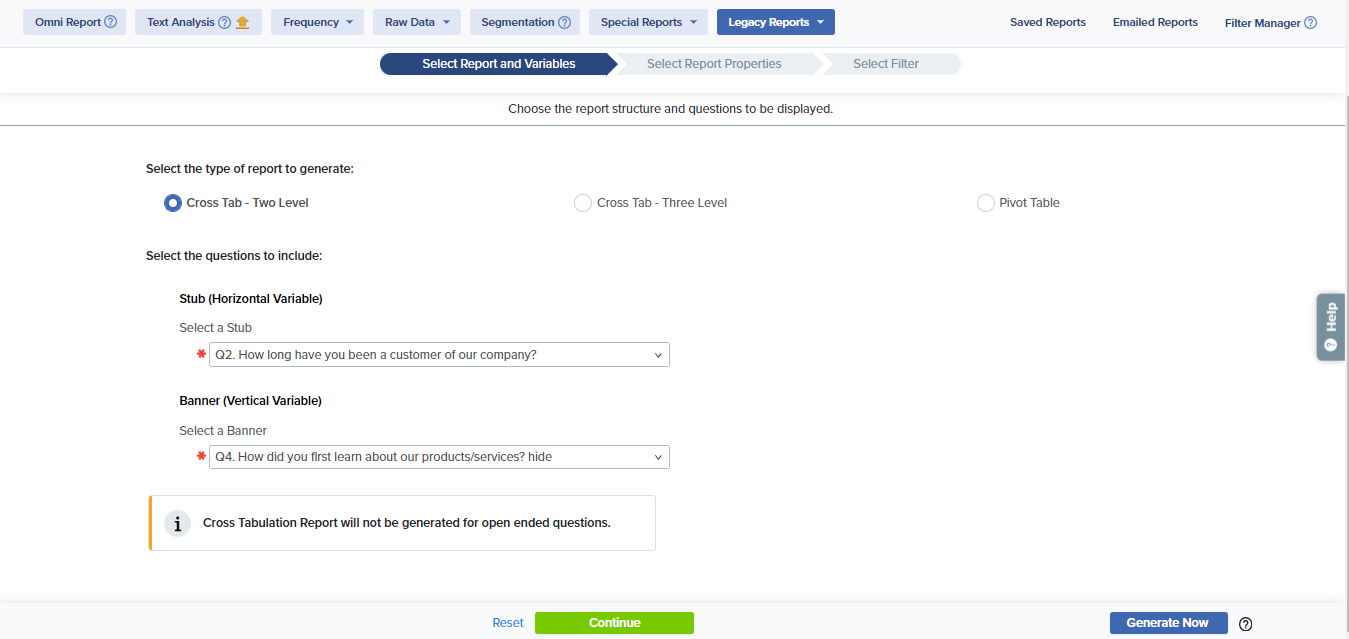
- Cross Tab – Two Level
This option will be selected by default. Choose your Stub (Horizontal Variable) and Banner (Vertical Variable) from the list of questions. For example, you might want to see whether an employee’s job satisfaction is correlated to tenure.
- Cross Tab – Three Level
You’ll need to add a parent question along with the Stub (Horizontal Variable) and Banner (Vertical Variable). For example, you might add a department question to see if there’s any variety in the potential satisfaction/tenure relationship across departments.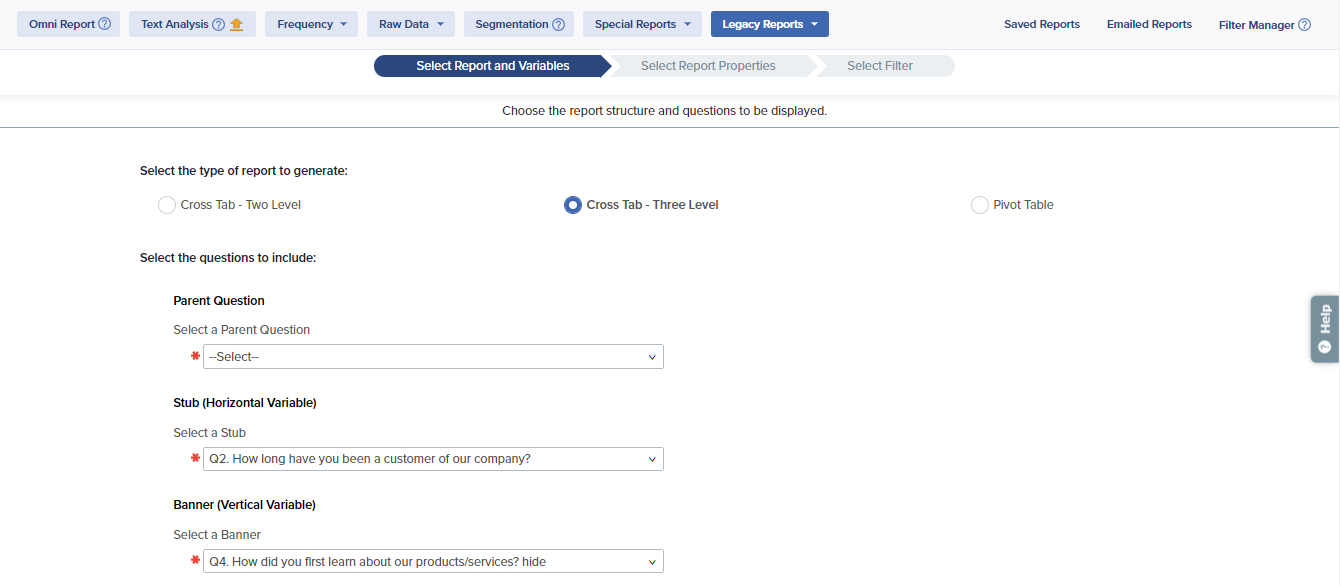
- Pivot Table
Choose a Stub (Horizontal Variable) and multiple Banner (Vertical Variable) questions. For example, you might want to see responses to multiple questions broken down by department to check for any possible relationships.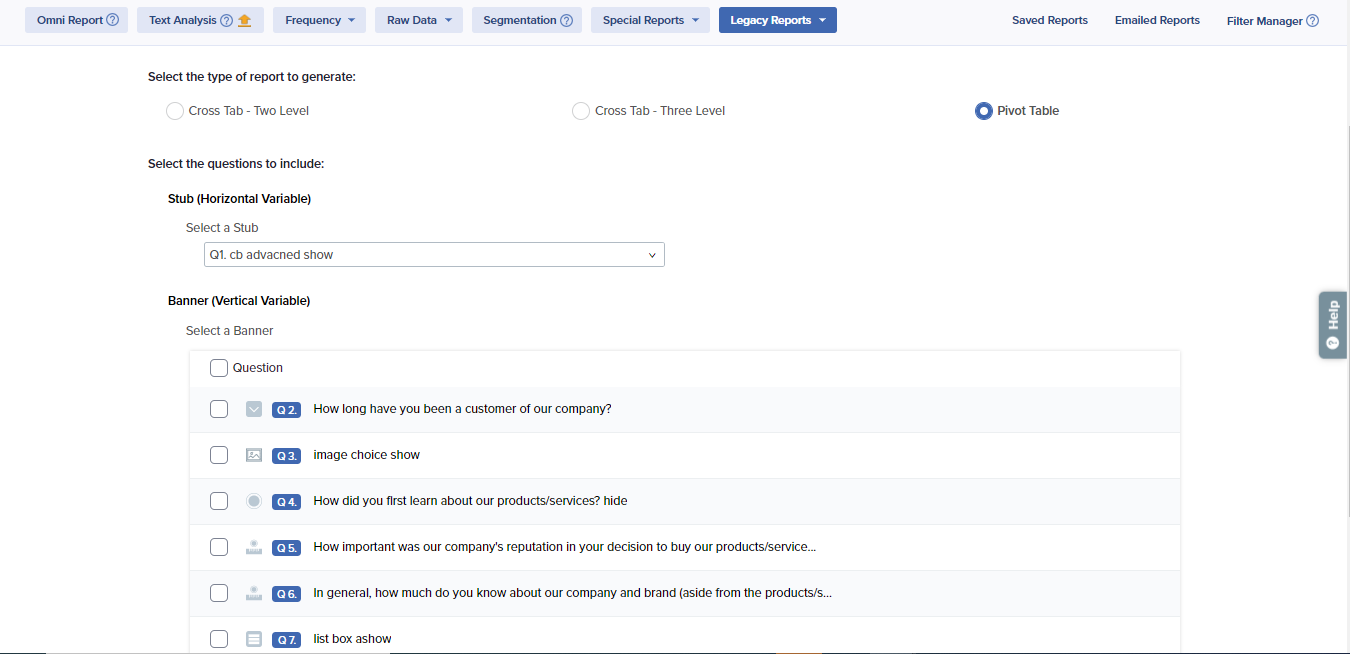
- Cross Tab – Two Level
- For either selection, you may follow the steps listed to complete and customize your report.
- Select properties that you want to display in your report:
- Display Count: Displays the response count in your report.
- Display Percentage: Lets you customize the number of decimals to be displayed for response percentage and also lets you choose to display percentage by column, row and total.
- Exclude All ‘Did not Answer’ is used to exclude the count of unanswered question from the number of total respondents for a question. Blank responses will not be displayed in the report.
- Include incomplete responses in the report is used to include partial responses that are yet to be submitted. Here, you can choose:
- All, to add all partially completed responses to the report
- Responses answered up to a specific question number
- Next, you may choose to apply a filter to your report based on desired conditions by selecting a filter from the dropdown list or by clicking on Create New to build a new filter.
- Click on Generate to generate the report.
You can always click Generate Now to skip report customization and create the report instantly.
Review/Modify Cross Tabulation Report
To modify a generated report, clicking on ‘Modify Report’ will redirect you to the first step of the report wizard.
Report Details
- Survey Metrics: Survey Metrics displays Date, Invitation, and Responses Metrics, which provide details about the responses included in the generated report. You may click on the Edit icon beside the Survey Metrics option to show or hide particular Date, Invitation, and Response Metrics.
- Properties and Filters: All report properties and response languages present in the generated report are visible here. You can edit, remove, or add the field which you want in the report by clicking on the Edit icon. If you are generating a report for a multilingual project, you may review responses submitted for particular language by selecting it from the language dropdown menu.
- Swap row and column: Question can be swapped by clicking on Swap rows and columns link.
You cannot swap rows and columns in Pivot Table.
- Commentary: Comments can be added in the report by clicking the ‘Add Commentary’ link.
- Edit: You can change the question text by clicking on the Edit icon.
- Modify Graph: Graphs displayed in the Cross Tabulation Report can be modified on the basis of the percentage of the response count of each question/all selected questions.
